
Table 3.
Genotype distribution of MRP2 variants in control and epilepsy patients
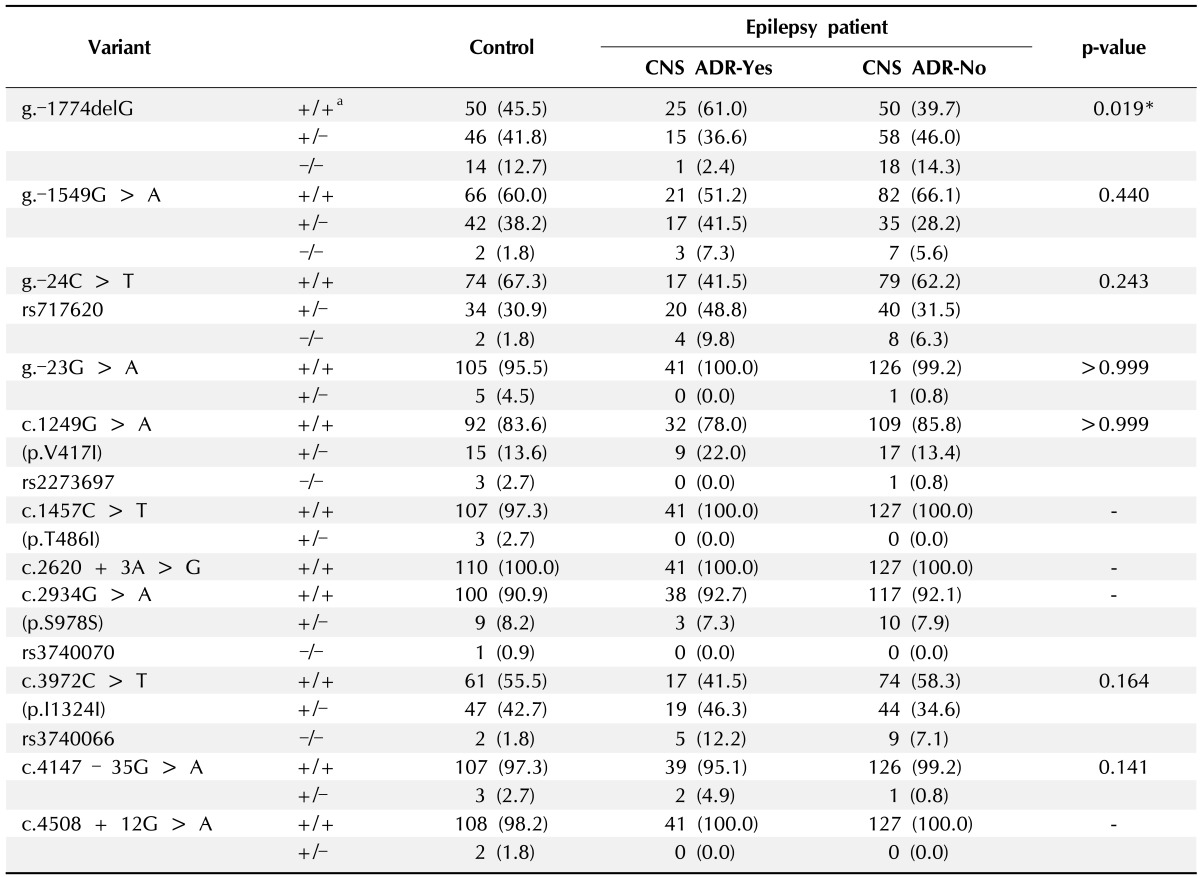
Values are presented as number (%).
CNS, central nervous system; ADR, adverse drug reaction.
a+, major allele; -, minor allele.
p-values (+/+ vs. -/-) were obtained by comparisons between CNS ADR-Yes and -No groups using chi-square or Fisher's exact test (expected cell value < 5). *p < 0.05.