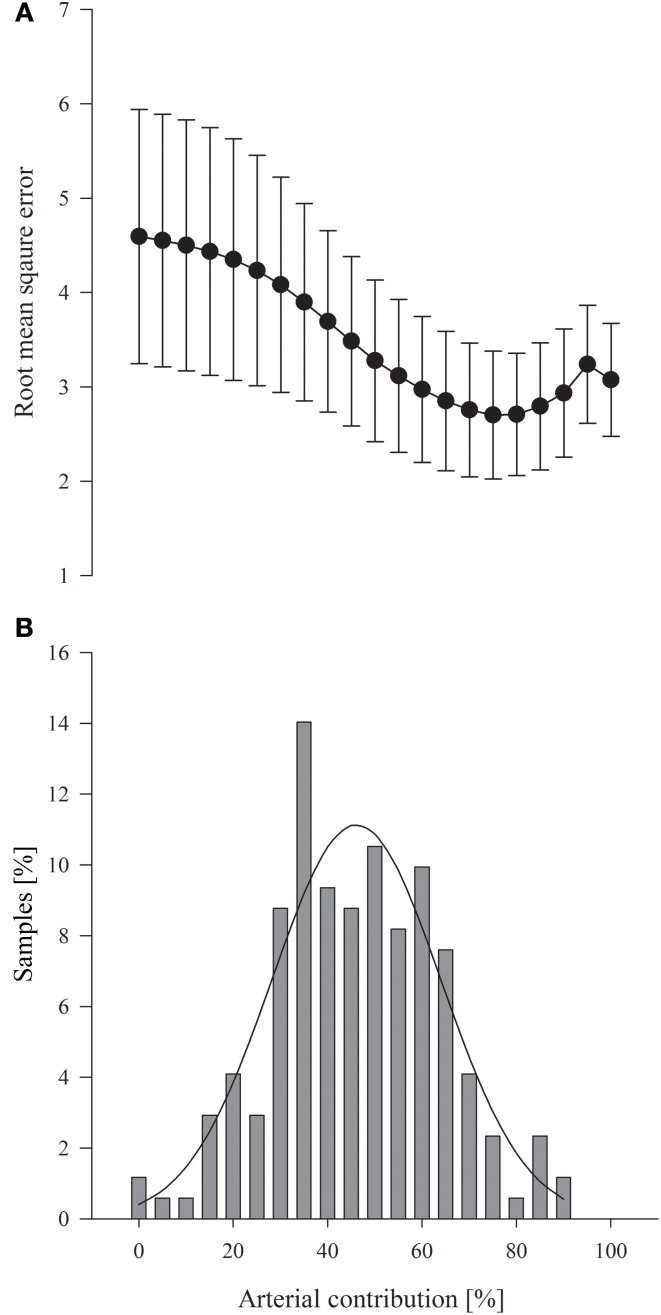
Figure 1.
(A) Root mean square error for the arterial fraction determined by the linear regression analysis. Values are mean (95% confidence interval). (B) Zero difference between the Invos-determined cerebral oxygenation (ScO2) and the calculated reference saturation related to the considered arterial contribution for 171 blood samples; average arterial contribution 46 ± 17% (SD). Solid line represents the mean distribution

