
Figure 6.
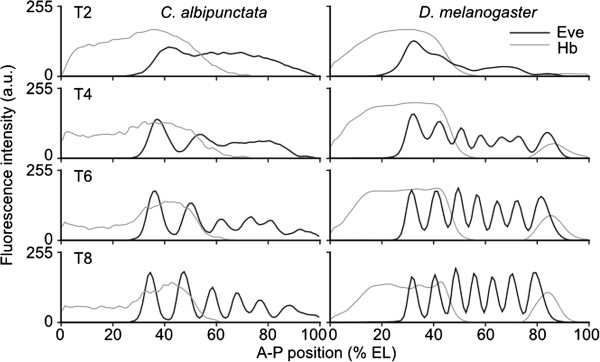
Relative positioning of Eve and Hb protein expression domains is conserved in Clogmia albipunctata compared to Drosophila melanogaster embryos. Integrated quantified expression patterns of Eve (black) and Hb (grey) are shown for C. albipunctata (left column) and D. melanogaster (right column) at time classes T2, T4, T6 and T8. Axes as in Figure 4. Scaling of expression levels as in Figures 4 and 5 to facilitate comparison. See text for details. a.u., arbitrary units; EL, egg length.