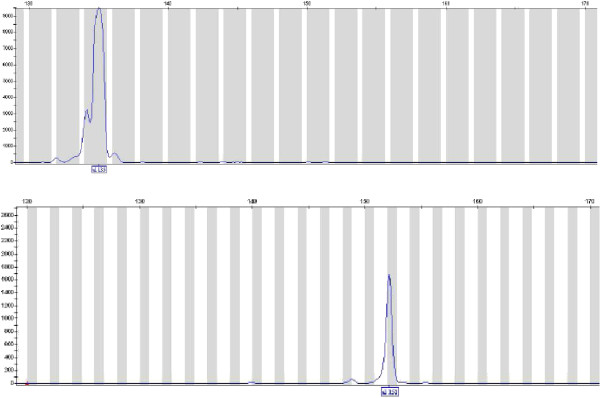
Figure 2.
Electrophoregrams from virus specimens. The two traces represent separate reactions on 2 DNA extracts (2008–017 and 2008–020). The boxed numbers under the peaks of the traces are the fragment sizes in base pairs assigned by comparison with the standard curve generated with the internal size standard.

