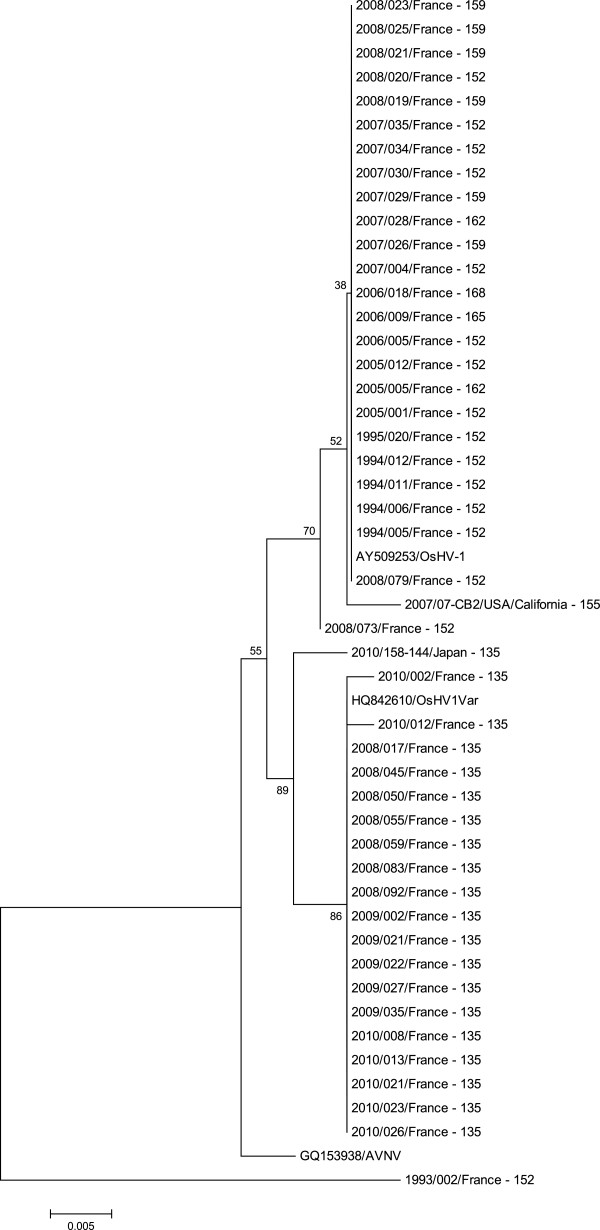
Figure 4.
Phylogenetic tree representing the relationships of virus specimens. Phylogenetic tree representing the relationships of 47 virus specimens (fragment lengths obtained by genotyping were included in specimen codes) and 3 reference sequences (OsHV-1, the variant μVar and AVNV) based on a fragment of the ORF4 and its up-stream zone (460 nts). Fragment lengths were included in specimen codes. The analysis involved 50 nucleotide sequences. Evolutionary analysis was conducted in MEGA5. The tree was generated by the Maximum Likelihood method.

