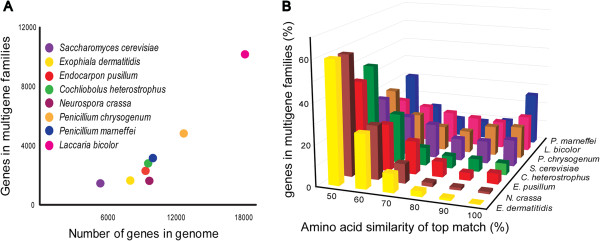
Figure 5.

Proportion of genes in multi-gene families. A. The graph displays the proportion of genes in multigene families from E. pusillum and other fungi. B. Histogram of paralogous gene numbers with different levels of amino acid similarity in E. pusillum and other fungi.
