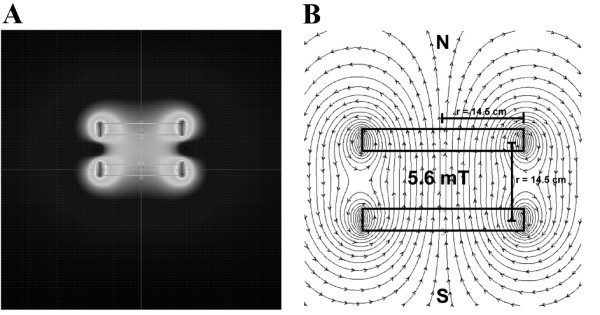
Figure 1.

Magnetic flux density (A) and flux lines distribution (B). Magnetic flux density and flux lines distribution in the area of exposure of the cells when the Helmholtz coils were powered with a direct current with the frequency of 100 Hz and an intensity of 2.0 Amperes.
