
Fig. 3.
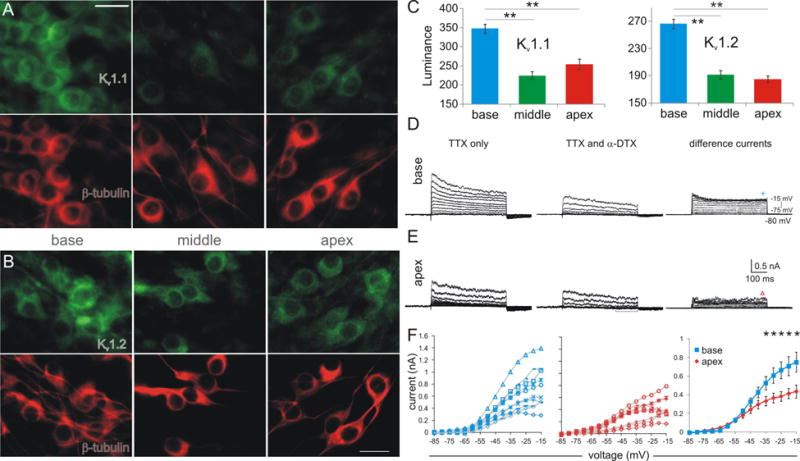
Anti-Kv1.1 and anti-Kv1.2 antibody somatic distribution along with DTX-sensitive Kv1 current magnitudes were greater in the base relative to middle and apex regions. (A-B) Immunostaining of α-subunits for Kv1.1 (A) and Kv1.2 (B) distribution (upper panels, green) in β-III-tubulin positive (lower panels, red) spiral ganglion neurons in the three regions of interest. Scale bar: 20 μm. (C) Average luminance from four separate experiments show enhanced Kv1.1 and Kv1.2 protein levels in the basal relative to the middle and apical neurons. Luminance from base to apex: Kv1.1, 348 ± 11, 224 ± 10, 254 ± 13; Kv1.2, 266 ± 7, 192 ± 6, 185 ± 5. (D-E) Whole-cell voltage clamp recordings of outward currents activated in response to 5mV voltage steps up to -15 mV from a holding potential of -80 mV before and after bath perfusion of α-DTX (left and middle panels with leak-subtraction) from a basal (D) and apical neuron (E). The difference currents (right panels) reflect the α-DTX sensitive component of Kv1 currents. These sweeps were created from non-leak subtracted traces in control and α-DTX conditions (see Methods). The bracket in E indicates possible Ih involvement in the leak-subtraction process. The symbol shape indicates which individual experiment is represented (from F); symbol location defines where the currents were measured for the current-to-voltage relationship as shown in F. (F) Kv1 current magnitudes plotted as a function of voltage levels for individual recordings (left panel, blue for base; middle panel, red for apex) and the average of all recordings in each group (right panel). The current magnitudes were significantly different at and above -35 mV, indicated by asterisks.