Fig. 5.

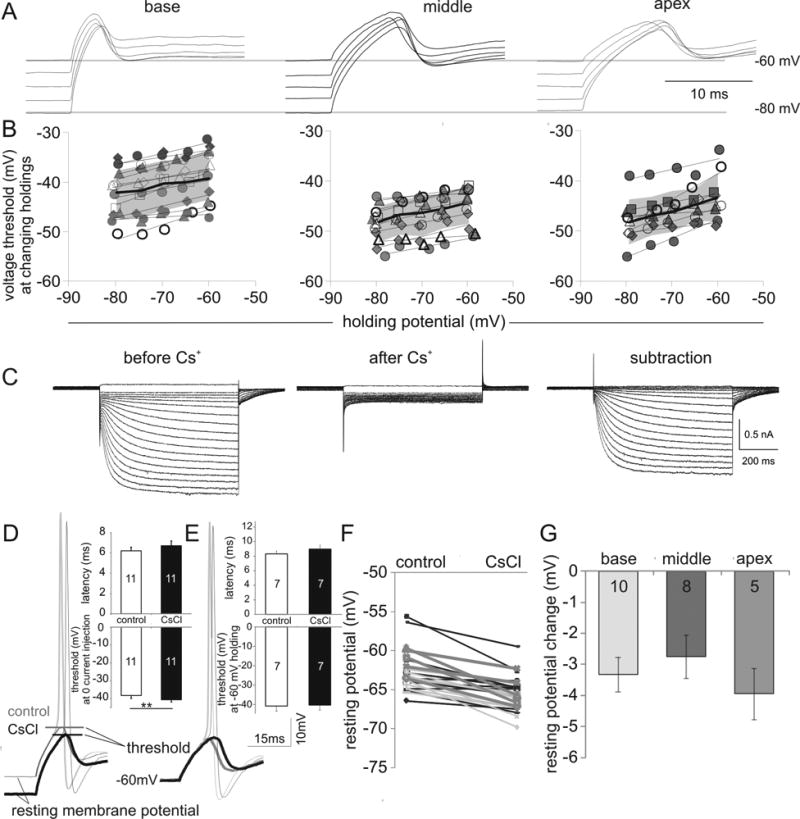
Blockade of Ih current with 5 mM CsCl hyperpolarizes neuronal resting potentials which, in turn, caused a predictable shift in threshold. (A) Altering holding potential causes concomitant changes in threshold. Traces show neuronal thresholds at five different holding potentials from -80 to -60 mV in 5 mV increments from individual basal, middle and apical neurons. (B) Threshold plotted against holding potential for each individual recording (symbols in different shapes or outlines) for base, middle and apex regions and for the group data (line and shadow plot). The thin black lines connect mean thresholds at each holding potential. Thick lines showed the means for each recording group with the gray background indicating one standard deviation. (C) Voltage clamp recording of inward currents in control (left) and CsCl conditions (middle); difference currents are shown on the right. Test potentials were from -55 mV to -160 mV in 5 mV intervals from a holding potential of -60 mV. The -60 mV trace at the same holding was not displayed. The specificity of Cs+ on Ih was confirmed from the difference currents that show no observable outward component. (D) Sample apical neuron traces show a hyperpolarizing shift of resting potential subsequent to CsCl perfusion. The threshold changes accompanying the resting potential shift are expected from A. Insets show bar chart comparison of average latency (6.22 ± 0.34 ms vs. 6.71 ± 0.45 ms, n = 11) and threshold (-38.28 ± 1.46 mV vs. -40.66 ± 1.18 mV, n = 11, p < 0.05) before and after CsCl treatment with zero current injection. (E) Sample traces from a middle ganglion current clamp recording show no threshold changes after the holding potential was restored to -60 mV following perfusion of 5 mM CsCl. The action potential latency was prolonged in this cell from 7.3 to 9.2 ms by CsCl. Insets show bar chart comparison of average latency (8.32 ± 0.36 ms vs. 8.97 ± 0.52 ms, n = 7) and threshold (-40.8 ± 2.44 mV vs. -40.25 ± 2.49 mV, n = 7) before and after CsCl treatment. (F) Pair-wise comparison of resting membrane potential before and after CsCl treatment. (G) Bar chart comparison of the average resting potential change from base to apex.
