Fig. 6.

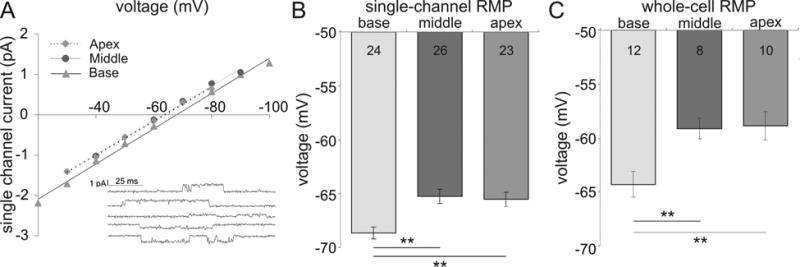
Endogenous resting membrane potentials show a nonlinear distribution along the cochlea that mirror the threshold distribution. (A) Single channel current-to-voltage relationships from individual base (filled triangle), middle (filled circle) and apex (filled diamond) neurons represent the differences in resting membrane potentials from base to apex. Inset shows examples of single channel currents at five test potentials (-100, -90, -70, -50, -40 mV). At reversal, the resting membrane potential is equal to the pipette potential therefore; the resting potential is more hyperpolarized in the base relative to the mid-apex. (B) The average resting membrane potentials from cell-attached single channel recordings show base neurons are the most hyperpolarized and middle neurons are slightly depolarized compared to the apex. (C) Measurement of resting potentials following membrane rupture for whole-cell current clamp mode showed values shifted to slightly more depolarized levels, yet showed a similar nonlinear trend as in B.
