Fig. 7.

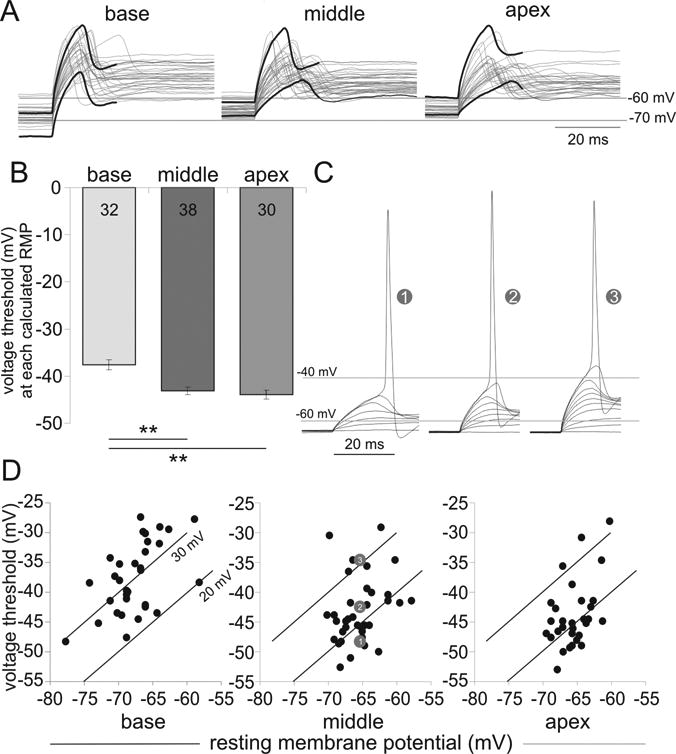
Differential voltage magnitude measured from endogenous resting potential to threshold demonstrates a nonlinear and heterogeneous distribution. (A) Overlay of threshold traces from multiple current clamp recordings, each held at its endogenous resting potential from the three cochlear regions. Black traces highlight the upper and lower extremes in threshold. (B) Average threshold (in mV, -37.59 ± 1.05, n = 32; -43.09 ± 0.9, n = 38; -43.91 ± 1.02, n = 30) from base to apex. (C) Three middle recordings (numbered symbols) with similar resting potentials show different threshold levels. Sub-threshold responses to increasing step current injection were overlaid for each recording. (D) Threshold plotted against resting potential for all recordings acquired in each region. Two differential voltage magnitudes of 20 and 30 mV are shown as a reference. Numbered gray circles indicate the three recordings shown in C.
