
Fig. 8.
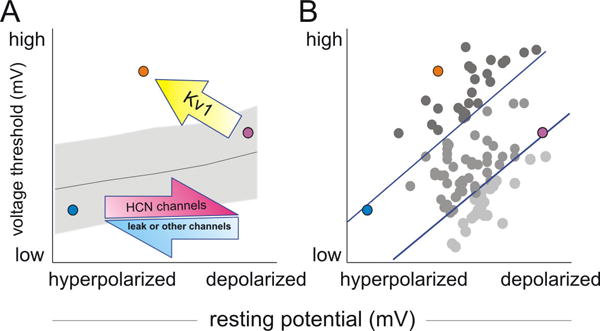
Depiction of the three currently identified mechanisms that primarily contribute to the diverse resting potential and threshold levels in cultured spiral ganglion neurons. (A) The blue and magenta arrows indicate the first mechanism of resting potential regulation. More HCN channels and potentially fewer leak channels or chloride channels or elevated Na+/K+-ATPase activity (Kim et al., 2007) would depolarize the resting potential along the x-axis. The line and shadow plot illustrate a second mechanism of indirect threshold regulation by resting potential. The combination of these two mechanisms slides the blue circle to the magenta position or vice versa. The third mechanism involves Kv1 regulation of threshold and resting potential. The yellow arrow indicates increasing Kv1 conductance could change the magenta circle to the orange position by elevating threshold and hyperpolarizing the resting potential. (B) The distribution of all neurons according to their threshold and resting potential could be explained by the three mechanisms outlined in A. The neurons were color coded based on their differential voltage magnitude above or below two arbitrary reference levels (blue lines).