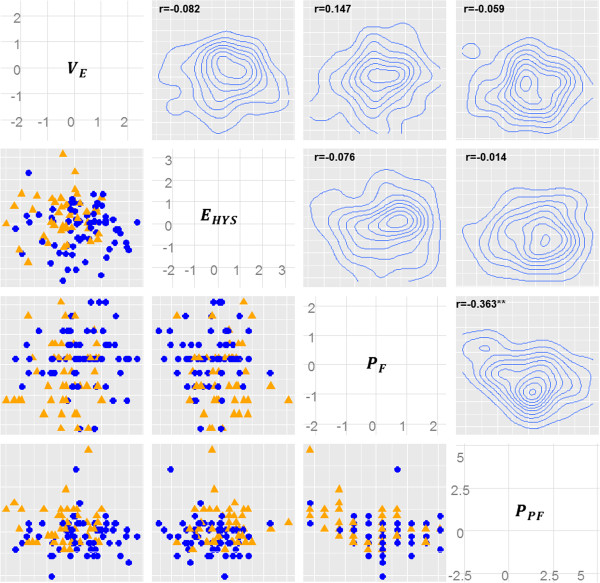
Figure 2.

Scatterplot matrix and density plots corresponding to all pairs of the four significant skin features. All skin features are scaled to a mean of 0 and a standard deviation of 1. Scatterplots and density plots are illustrated in the lower triangular and upper triangular elements of the matrix plot, respectively. Blue circles and orange triangles on the scatterplots denote samples in the TE group and SE the group, respectively. Pearson correlation coefficients from the four skin features are denoted in the top left of the density plots.
