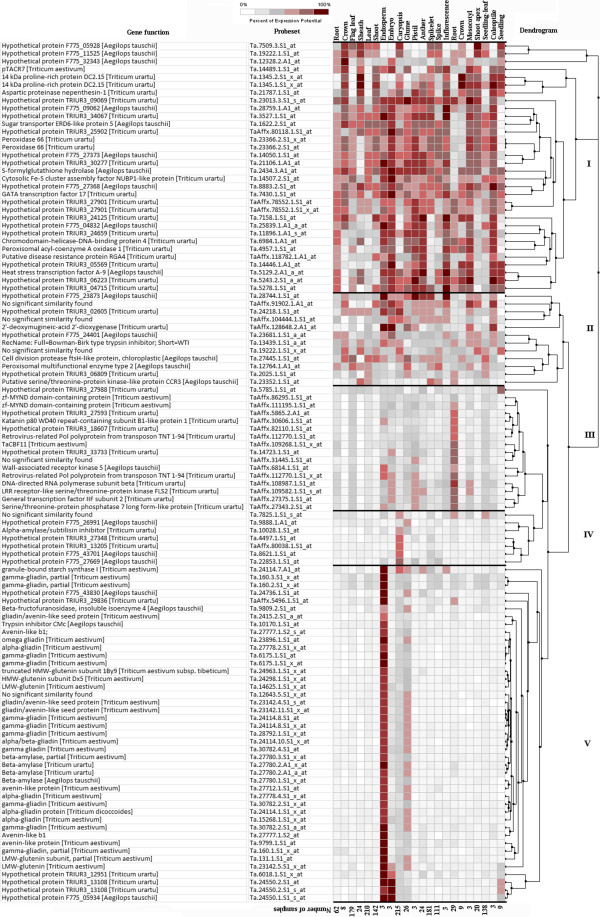
Figure 5.
A heat map of the 110 probe sets (identified for quality) indicating level of expression potentials in 22 wheat tissues such as endosperm, glume, caryopsis, embryo, leaf, root, coleoptile, mesocotyl, seedling, sheath, shoot, shoot apex, leaf, flag leaf, crown, inflorescence, spikelet, pistil, anther, glumes, caryopsis, endosperm, embryo. The expression potentials of the 110 probe sets were estimated in 1,405 samples available in the Affymetrix®’s Triticum aestivum microarray database. The darkest red color represents the highest level of probe set expression. The expression potential is defined as the average of the top 1% signal values across all samples for a given probe set in a given platform. The heat map was generated in Genevestigator (Nebion AG, Zurich, Switzerland). ‘Root’ labelled at 16th column of the heatmap represents ‘roots of seedling’. ‘Crown’ labelled at 17th column of the heatmap represents ‘Crown of seedling’.

