Figure 3.

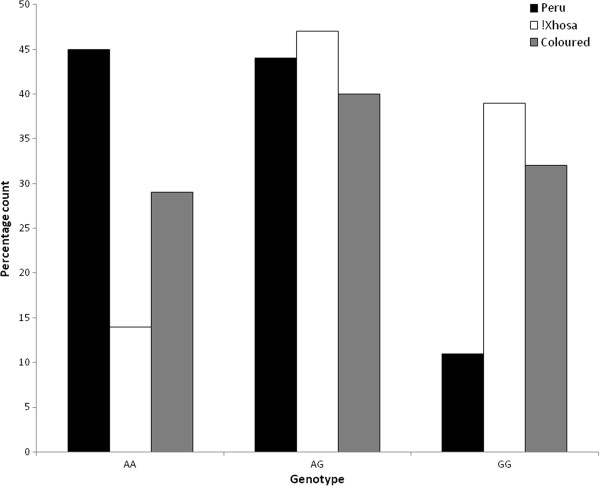
Distribution of CCR5 genotypes in the different populations. The distribution of CCR5 genotypes in the different populations, with the Peruvian population in black, !Xhosa population in white and Coloured population in grey.

Distribution of CCR5 genotypes in the different populations. The distribution of CCR5 genotypes in the different populations, with the Peruvian population in black, !Xhosa population in white and Coloured population in grey.