Figure 2.

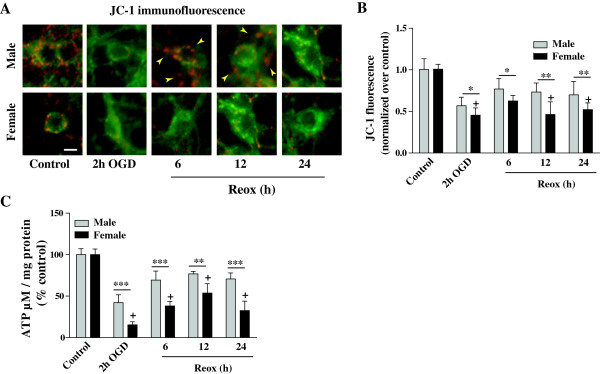
Sequential changes of JC-1 fluorescence and cellular ATP levels in XY and XX neurons upon exposure to OGD and reoxygenation. A) Mitochondria appeared as yellow in control cells, which turned to partly green following OGD and later turned red with increasing intensity in XY neurons as compared to XX neurons (40 X magnification) during the Reox. Scale bar 10 μm. B) Quantification of JC-1 fluorescence (red-to-green ratio) show change in fluorescence intensity during OGD/Reox. JC-1 fluorescence was normalized with the control red-to-green ratio (taken as 1). Mitochondria show a significant decline of membrane potential ΔΨm at 2 h of OGD, with more membrane potential loss observed in XX neurons as compared to XY neurons. Results are mean ± SD (n = 4, *p < 0.05, **p < 0.01, XX vs. XY, +p < 0.05 vs. control. C) Exposure to OGD (2 h) and Reox (6, 12 and 24 h) resulted in significant reduction of cellular ATP levels with much greater reduction observed in XX neurons than in XY neurons. Data were expressed as percentage of control (100%) and shown as mean ± SD for at least three separate experiments (**p < 0.01, ***p < 0.001, XX vs. XY; +p < 0.01 vs. control). One-way ANOVA followed by Bonferroni/Dunn post hoc test was applied.
