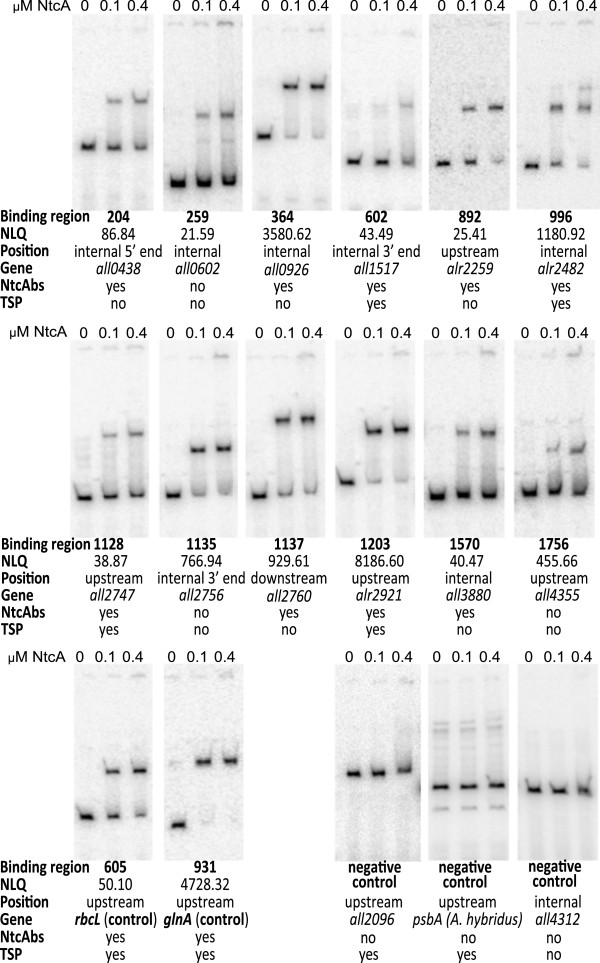
Figure 3.
Electrophoretic mobility shift assay of several binding regions. Results of the EMSA carried out using DNA fragments from the indicated binding regions tested, using the indicated NtcA concentrations. The NLQ value, position with respect to the gene, the ascribed gene, the NtcA binding site identified, and the presence of a TSP are indicated.

