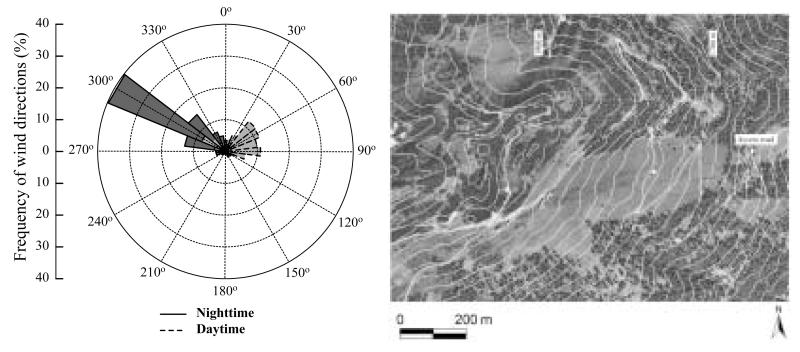
Figure 2. Frequency distribution of wind directions (north = 0°, east = 90°) for daytime (dashed line and grey shading) and nighttime (solid line and black shading) conditions at the study site Kaserstattalm on the left, and orthophotography of the area surrounding the eddy covariance tower (indicated by a dot) on the right.
Contour lines refer to a 20 m difference in elevation.

