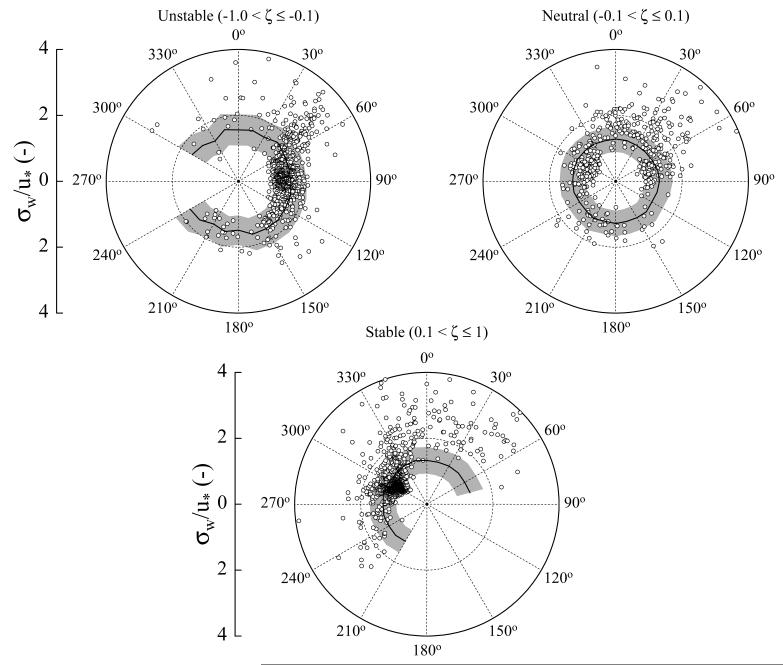
Figure 4. Directional distribution of the ratio of the standard deviation of vertical velocity (σw) to friction velocity (u*) at the study site Kaserstattalm for unstable, neutral and stable conditions.
Symbols indicate measurements, lines and grey areas the average and ± 30 % range, respectively, of σw / u* calculated according to Eq. 1 from the average stability parameter in each sector.

