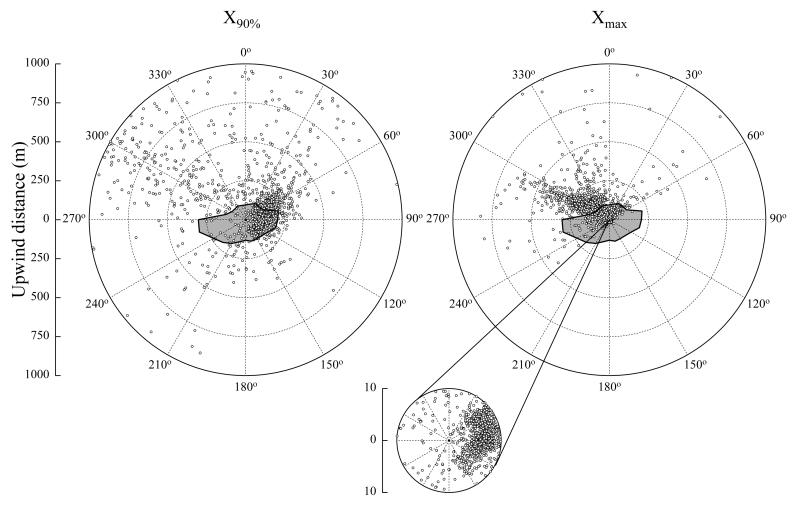
Figure 5. Upwind distance for the measured flux to represent 90 % of the surface flux (X90%, left) and the upwind distance to the peak location of the footprint (Xmax, right) at the study site Kaserstattalm calculated with the footprint model by Hsieh et al. (2000).
The inset on the right shows Xmax in a 10 m radius around the flux tower, the grey areas indicate the boundaries of the meadow.

