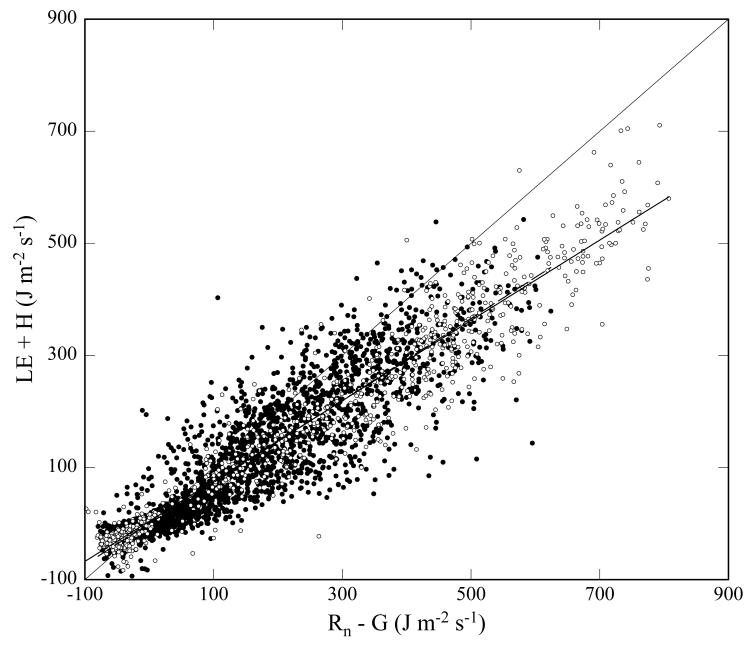
Figure 9. Comparison between the available energy, i.e. net radiation (Rn) minus soil heat flux (G) and sum of the latent (LE) and sensible (H) heat fluxes for the study sites Kaserstattalm (open symbols and solid line) and Neustift (closed symbols and dashed line).
Bold lines represent linear regressions, the thin line indicates 1:1 correspondence.

