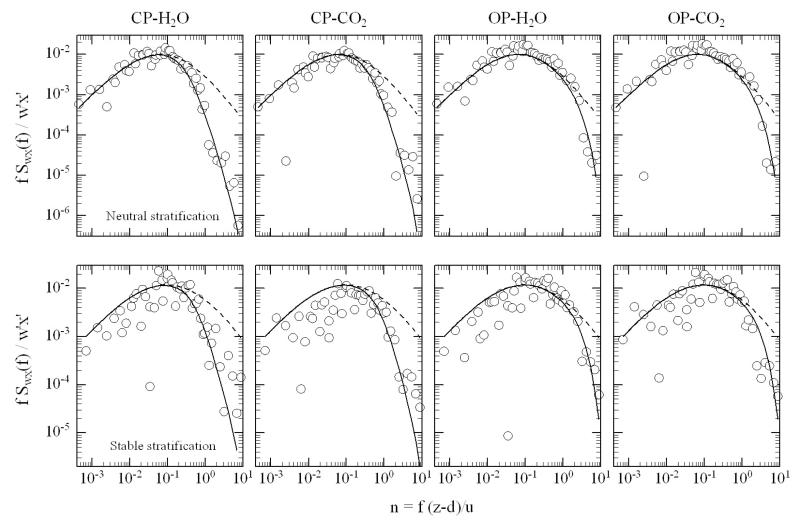
Figure 1.
Comparison between measured cospectra (symbols), site-specific model cospectra (solid lines; see Wohlfahrt et al., 2005) and model cospectra attenuated with appropriate transfer functions to account for high frequency losses of CP and OP systems. Upper and lower panels refer to near-neutral (13.07.2003 11:30-12:00; average wind speed = 3.3 m s−1) and stable (19.07.2003 20:00-20:30; average wind speed = 2.1 m s−1) conditions, respectively.

