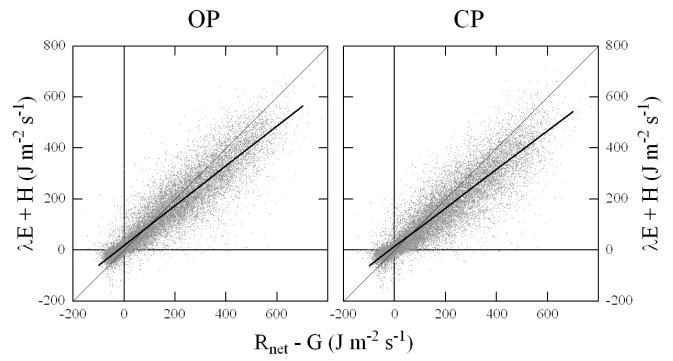
Figure 4.
Energy balance closure for the OP (left) and CP (right) system. Plotted are the available energy (net radiation minus soil heat flux) on the x-axis and the sum of sensible and latent heat flux on the y-axis. Symbols represent half-hourly fluxes, thin solid lines the 1:1 correspondence, and thick solid lines linear regressions (refer to text for regression statistics).

