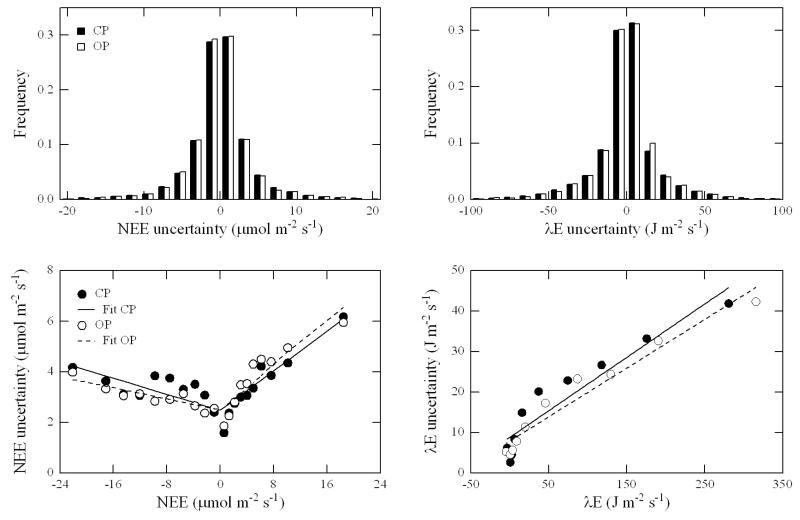
Figure 5.
Analysis of random flux uncertainty according to Richardson and Hollinger (2005). Panels on the left and right show CO2 and latent heat flux random uncertainties, respectively. Upper panels show the probability density distribution of random flux uncertainties, lower panels the best parameterisation of random flux uncertainties. For the random CO2 flux uncertainty a double-linear relationship with the flux magnitude was used to describe variability in uncertainty (CP: y = 0.19× + 2.48 and y = −0.08× + 2.48, r2 = 0.78; OP: y = 0.20× + 2.50 and y = −0.05× + 2.50, r2 = 0.86), while for the random latent heat flux uncertainty a single linear relationship was used (CP: y = 0.13× + 8.83, r2 = 0.89; OP: y = 0.12 + 7.90, r2 = 0.95). Closed bars/symbols and solid lines refer to the CP system, open bars/symbols and broken lines to the OP system. Symbols represent bin-averages with equal numbers of observations.

