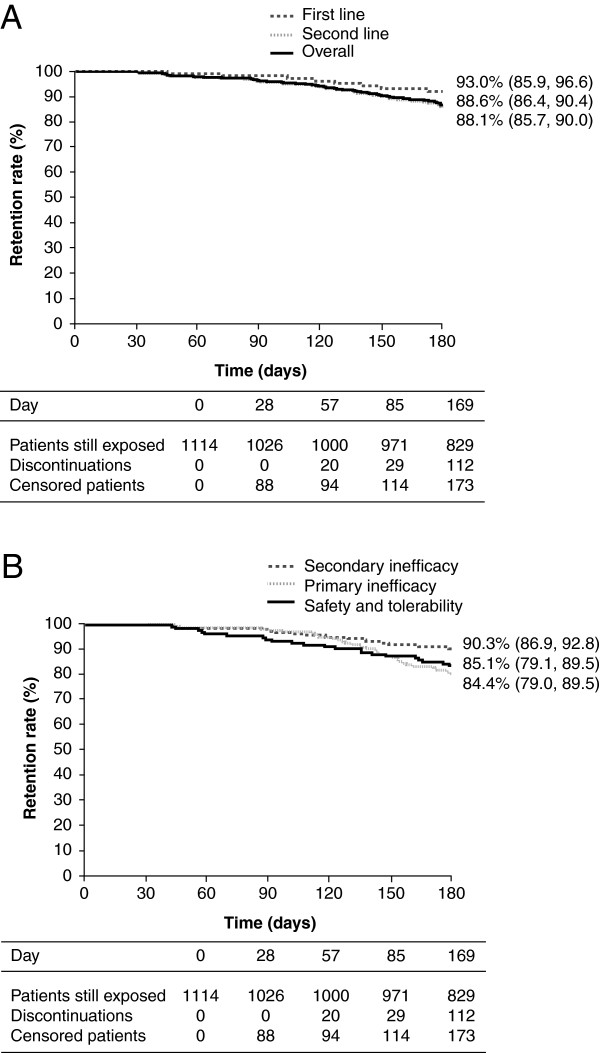
Figure 2.
Kaplan–Meier estimated patient retention rates at month 6. The estimate is given for each patient group with 95% CIs. (A) Kaplan–Meier curves for the overall patient population, the first-line group and the second-line group. (B) Kaplan–Meier curves based on reasons for discontinuation of prior biologic therapy are shown for patients who discontinued due to primary inefficacy, secondary inefficacy, or safety and tolerability reasons. CI, confidence interval.

