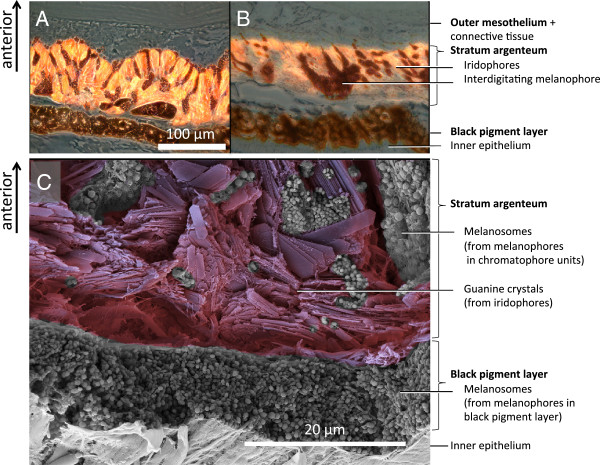
Figure 7.
Sections of T. delaisi irides, showing chromatophore location. Micrographs of the iris with melanophores before (A) and after (B) KCl treatment. Before KCl treatment, melanosome projections extend over the top of the fluorescent structures and suppress fluorescent emission. After KCl treatment (B) they are retracted and facilitate fluorescent emission. C: SEM picture of a fractured, untreated iris with similar layering, showing the contents of the chromatophores: Guanine crystal platelets from iridophores, and melanosomes (black pigment vesicles) from melanophores.

