Figure 3.
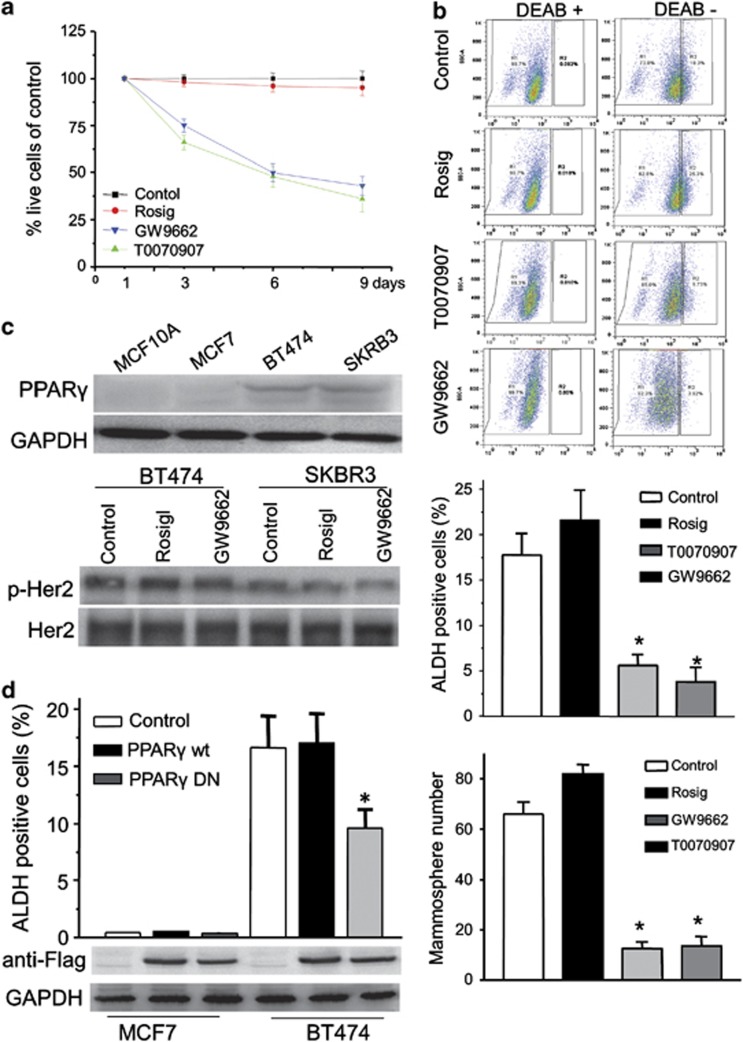
PPARγ inhibition results in decreased numbers of CSCs in ERBB2-positive cancer cells. (a) Cell counts of BT474 cells treated with vehicle, 10 μM of PPARγ agonist rosiglitazone and 10 μM of PPARγ antagonist GW9662 or T0070907 for 3, 6 and 9 days. Results are presented as percentage of control. (b) FACS profiles identifying ALDH-positive cell populations are shown for BT474 cells treated as in a. Quantification of ALDH-positive cells (middle) and tumorsphere formation (bottom) in BT474 cells treated as in (a). Bars denote the s.e. for n=3, *P<0.001.(c) PPARγ expression levels determined by immunoblotting in MCF10A and breast cancer cell lines. GAPDH was used as loading control. BT474 and SKBR3 cells were treated with rosiglitazone, GW9662 or control for 9 days. Cell lysates were probed with anti-Her2 or anti-phospho-Her2 antibodies (bottom). (d) Expression of a DN mutant form of PPARγ reduces the ALDH-positive cells in BT474. MCF7 and BT474 cells were transfected with PPARγ-wild type, PPARγ-DN or control vector. ALDH-positive cells are shown (top). Bars denote the s.e. for n=3, *P<0.001. Immunoblotting was performed to test PPARγ-wild type or PPARγ-DN expression level using anti-Flag antibody. GAPDH was used as loading control.

