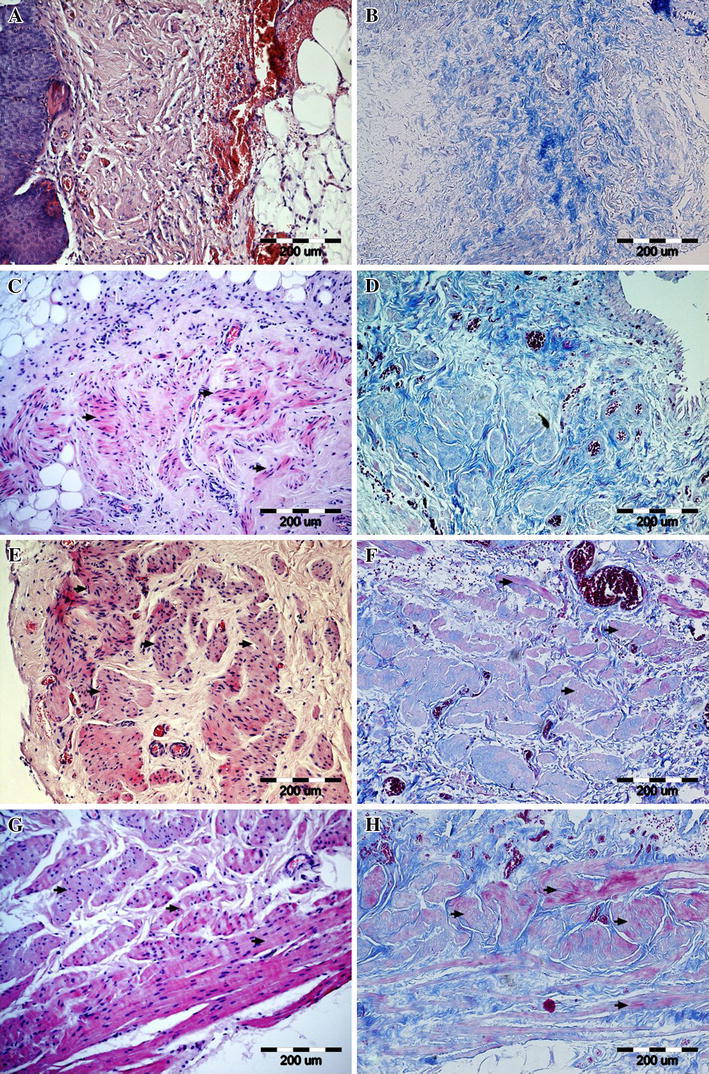
Fig. 4.

Representative images of the smooth muscle regeneration: (a, b) absent (0, second group) (c, d) segmental (1, second group) (e, f) normal with reduced abundance of muscle fibers (2, first group) (g, h) normal (3, fifth group-control) in tissue samples stained with hematoxylin and eosine (a, c, e, g) and histochemical connective tissue staining method (b, d, f, h). Smooth muscles are marked with arrows. Light microscope, scale bar 100 μm
