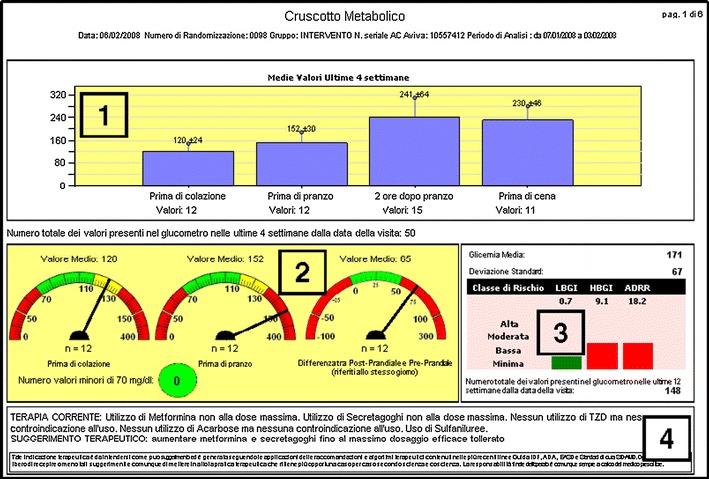
Fig. 2.

Data analysis system. The print-out of the Smart-Pix device is organized in four boxes: Box 1 shows mean, standard deviation, and number of glucose measurements during the previous 4 weeks, by point of the daily profile presented as a bar graph; Box 2 shows mean and number of glucose measurements during the previous 4 weeks before breakfast and lunch and mean and number of post-prandial glycemic excursion, each presented as a speed dial: the pointer in the green zone indicates desirable values, in the yellow zone values that requires attention, and in the red zone values that require corrective action; the number of hypoglycemic episodes is reported in a dot that changes color from green (no glucose value <70 mg/dl) to red when blood glucose values <70 mg/dl are measured; Box 3 shows the low blood glucose index (LBGI) and high blood glucose index (HBGI) [40] and the average daily risk range (ADRR) [49] calculated on the glucose values since the last visit and presented as a bar graph in green color if in the desired range, in red if outside the desired range; and Box 4 shows the suggested changes in diabetes medication according to the algorithm presented in Fig. 3
