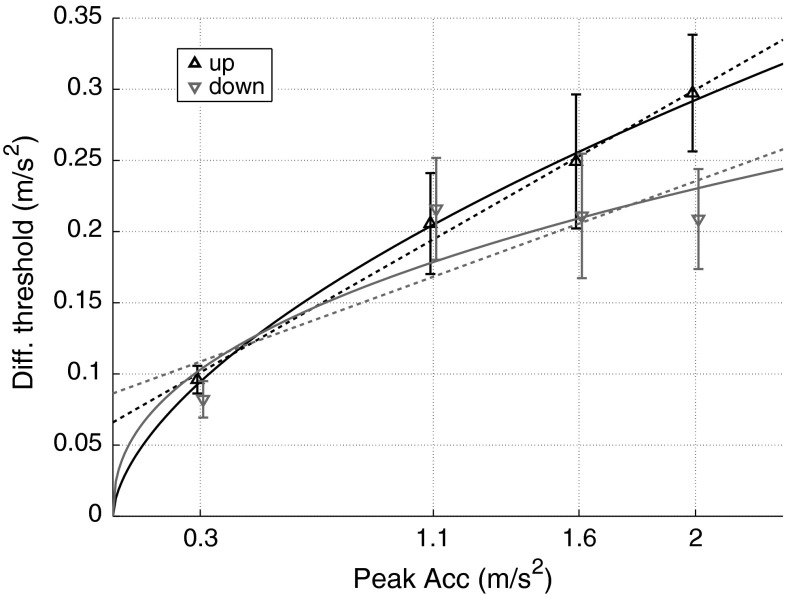
Fig. 5.
Differential thresholds for upward movements (black triangles) are significantly higher than for downward movements (gray triangles). Error bars are SEM. Their relationship with the motion intensity is more consistent with a power function (black and gray continuous lines) as opposed to a linear fit (black and gray dashed lines)

