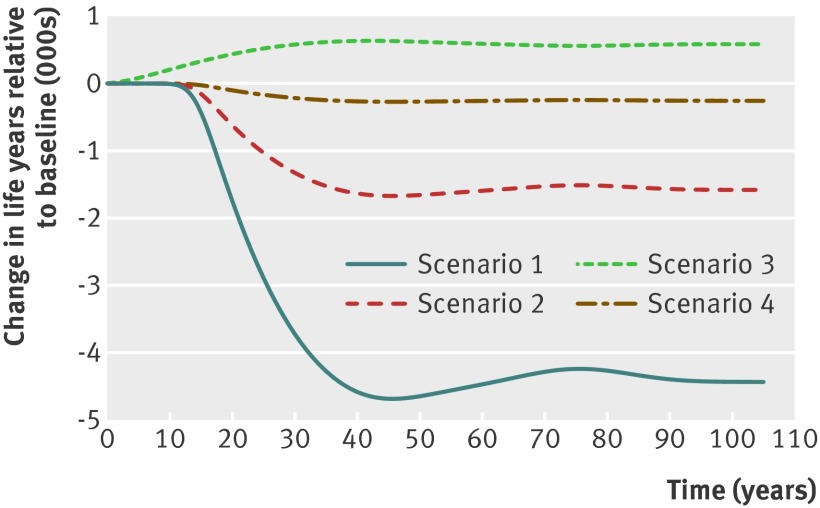
Fig 3 Change in life years lived in population (relative to baseline) over time for each scenario. Negative figures indicate loss of life years. Scenario 1=air tightness; scenario 2=air tightness+purpose-provided ventilation; scenario 3=as for scenario 2+mechanical ventilation and heat recovery (MVHR); scenario 4=as for scenario 3+10% failures in MVHR

An official website of the United States government
Here's how you know
Official websites use .gov
A
.gov website belongs to an official
government organization in the United States.
Secure .gov websites use HTTPS
A lock (
) or https:// means you've safely
connected to the .gov website. Share sensitive
information only on official, secure websites.
