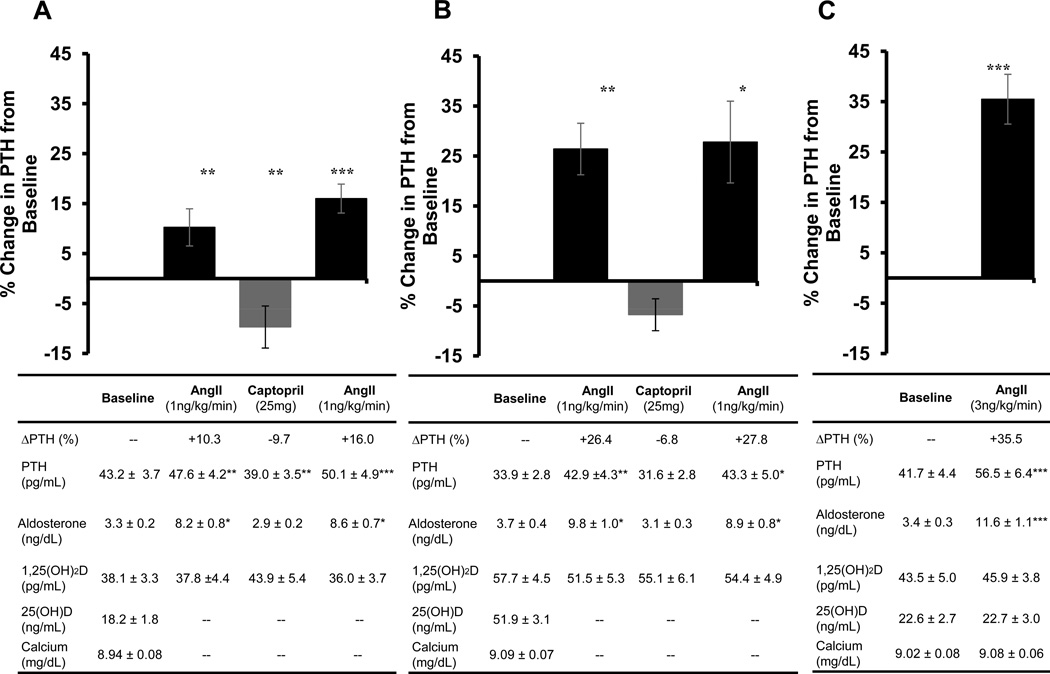
Figure 1. Acute modulation of PTH with RAAS manipulation.
Changes in PTH are displayed graphically as the percent change in PTH from baseline in response to either AngII infusion or ACE inhibition. Absolute values of PTH and related parameters are presented in the table below each graph. A) Study 1 (vitamin D deficient phase): The acute PTH-response to a 1 ng/kg/min infusion of AngII before and after a single dose of Captopril 25mg prior to vitamin D3 intervention. B) Study 1 (vitamin D sufficient phase): The acute PTH-response to a 1 ng/kg/min infusion of AngII before and after a single dose of Captopril 25mg after vitamin D3 intervention. C) Study 2: The acute PTH-response to a 3 ng/kg/min AngII infusion.
Data are presented as means ± SEM. All comparisons are made with the visit baseline values.
*p<0.05, **p<0.01, ***p<0.001.

