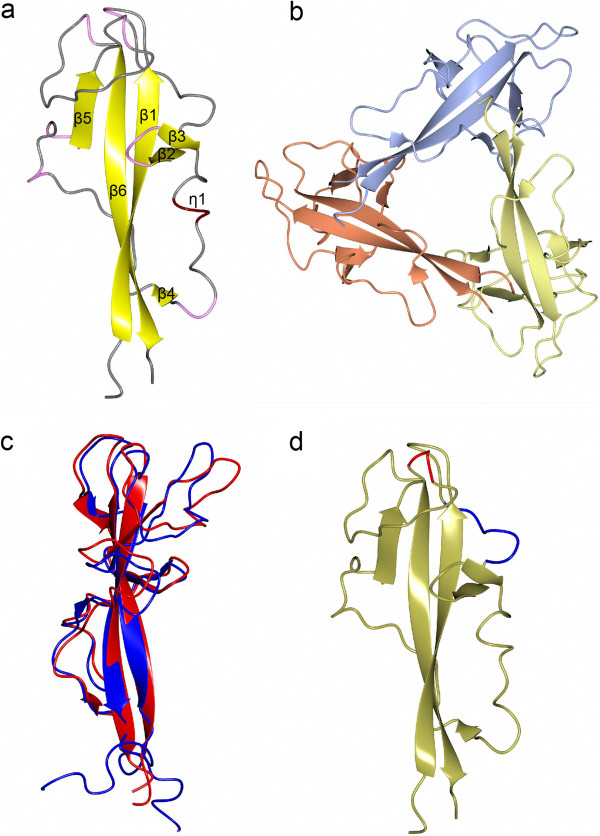
Figure 2.
Comparison of DysF domain structures. Ribbon presentation of a) P213 asymmetric unit (the beta strands are coloured in yellow, 3 turn in pink, 4 turn in tan and no structure in grey) and b) P212121 asymmetric unit coloured by chain. c) Superimposed models of myoferlin NMR DysF domain (blue) with dysferlin crystal DysF domain (red). d) Two areas of very high B factor in dysferlin DysD domain coloured in blue (965-971) and red (1018-1021). Orientation as in Figure 2a). Figure drawn with CCP4mg [19].

