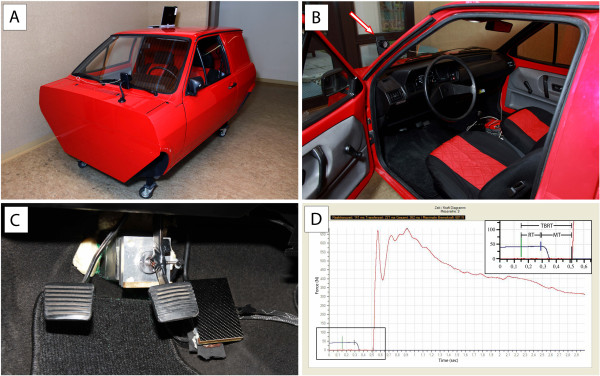
Figure 1.

Experimental setup and recorded data. (A) Custom-made car simulator (VW Polo) for measuring total brake response time (TBRT), reaction time (RT), movement time (MT) and brake force (graph in D). (B) View of the driver cabin – the white arrow indicates the red flashlight. (C) Overview of the pedals with the accelerator pedal on the right and the brake pedal in the middle, both equipped with a pressure sensor, and the clutch pedal on the left. (D) Graph of computer output data, showing TBRT, RT and MT. The top right insert is an enlargement of the bottom left section of the graph. The green vertical line indicates the triggering of the red flashlight, the blue vertical line the beginning of pressure decrease (blue plot) on the accelerator pedal, and the black vertical line the beginning of pressure increase on the brake pedal (red plot).
