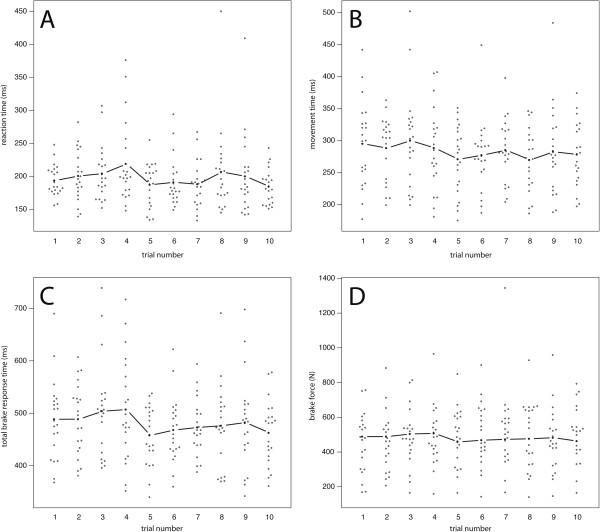
Figure 2.
Reference values for RT, MT, TBRT and BF under defined experimental conditions. (A) RT, (B) MT, (C) TBRT and (D) maximum BF of the control group for ten iterations of the experiment. No significant learning curve or deterioration due to exhaustion is observed. White dots represent individual values; the black lines show their median.

