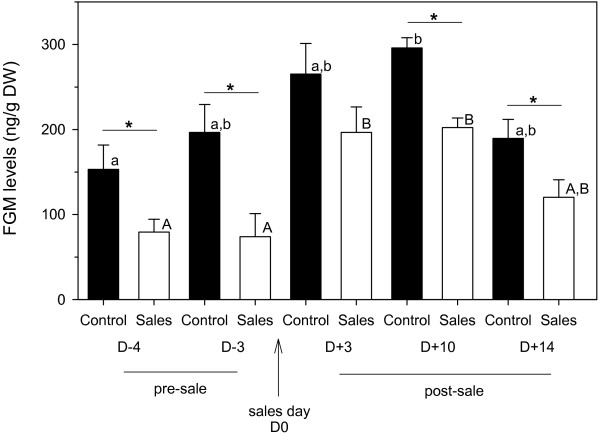
Figure 1.
FGM concentrations (mean + SEM) of mares in the control (N = 6) and sales groups (N = 8) at the selected sampling points D-4, D-3, D + 3, D + 10 and D + 14 with respect to the day of the sales. Asterisks indicate statistically significant differences between the two groups at a respective sampling point, determined using t-tests. Different superscripts (capital letters = Sales group; lower case letters = Control group) indicate statistically significant differences between sampling points within the respective group, determined using one-way repeated measures ANOVA.

