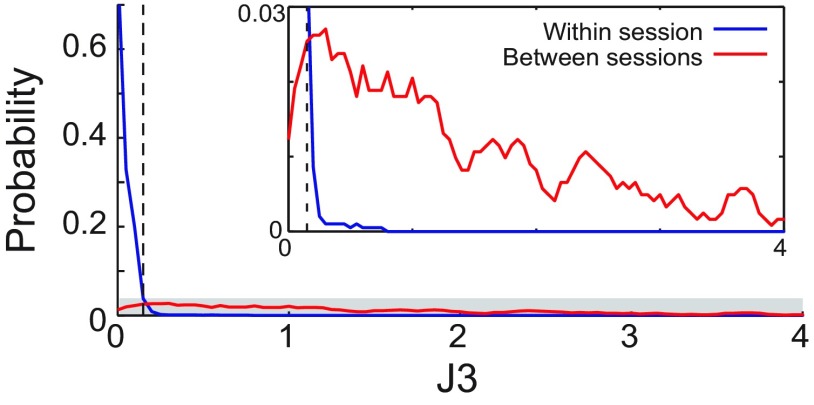
Figure 2.
Within- and between-session J3 statistic distributions. The within-session distribution (blue) displays a rapid decline from a maximum near zero, consistent with the isolation of a single waveform. The dashed vertical line indicates the 95th percentile of this distribution. The between-session J3 statistic distribution (red) was much broader, indicating that only a small fraction of these isolations were as stable between sessions as 95% of the within-session isolations. This small fraction of isolations were deemed “held neurons.” Inset, Grayed area (Nwithin = 383, NBetween = 244).

