Figure 4.
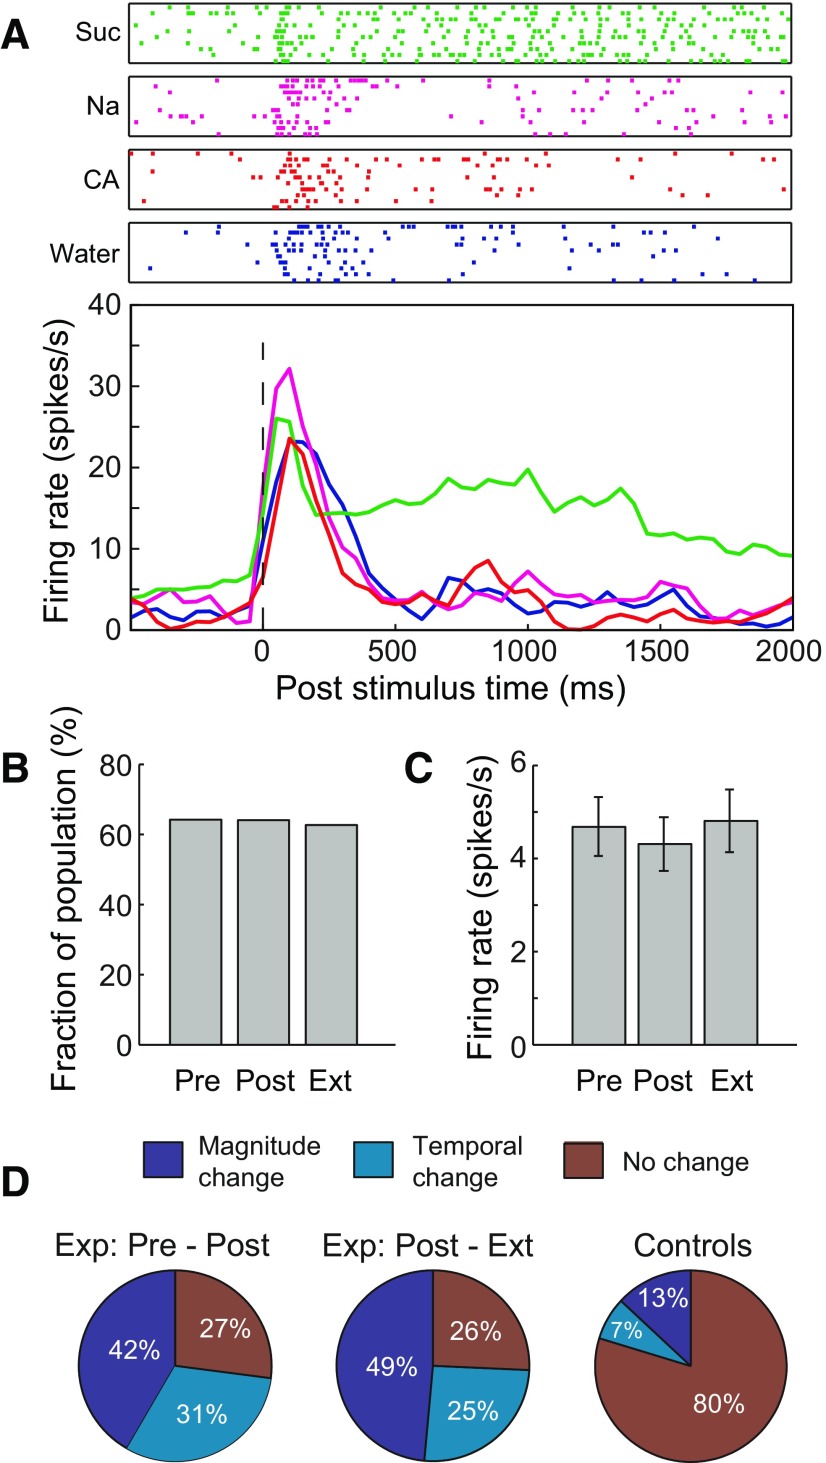
Single-neuron responses to sucrose change across sessions. A, Spike-time rasters (top) and PSTHs (bottom) for an example cortical neuron's responses to water, Na, Suc, and CA in Pre. B, Similar fractions of the single-neuron sample are taste responsive in each session (χ2(2, N = 383) < 1). C, Average sucrose-induced firing rates are similar for all sessions (F(2, N = 383) < 1). D, Percentages of Suc responses that changed (in overall average rate or temporal code) between pairs of sessions in neurons held for ≥24 h. Controls differ from both pairs of sessions of conditioned rats (χ2 test, p < 10−13, NPre-Post = 48, NPost-Ext = 35, Ncontrols = 69).

