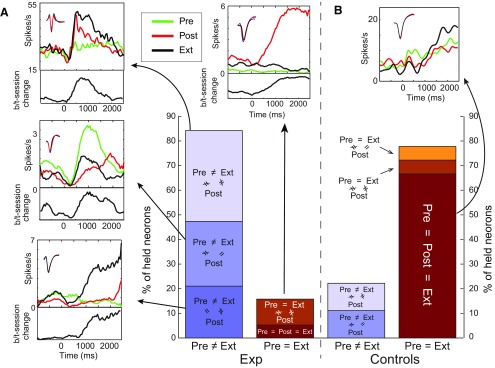
Figure 5.
Single neurons firing does not track behavioral responses to sucrose in conditioned rats. A, Ext and Pre responses were similar for only a small minority of neurons held for 49 h in the conditioned rats group (bar chart). Suc PSTHs surrounding the bar plot depict examples of each observed pattern (e.g., Pre = Post, but neither = Ext). Insets, Neuron spike shape across days. Panels below PSTHs, Average differences (in sucrose-induced spike rate) between sessions. B, In the control group (N = 5), the vast majority of held neurons (N = 18) retain their responses to sucrose across three consecutive days, in contrast to the conditioned group (χ2(1, N = 37) = 58.5, p < 10−13).

