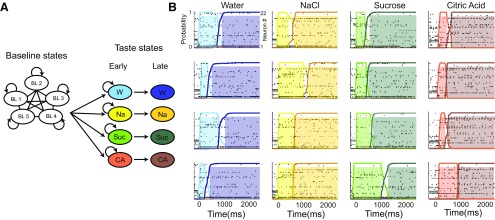
Figure 6.
HMM. A, The HMM used to analyze ensemble responses to each stimulus, including 5 baseline states and 4 pairs (one/taste) of driven states. B, Example ensemble responses characterized using this HMM: the colored lines overlain on the ensemble of spike trains (each row is a neuron, y-axis) indicate the calculated probability that the ensemble is in that particular state (color coding as in A); shaded regions represent time periods during which the dominant state has p > 0.8. The same state sequence was observed for each trial of a stimulus, but interstate transition timing varied from trial to trial.

