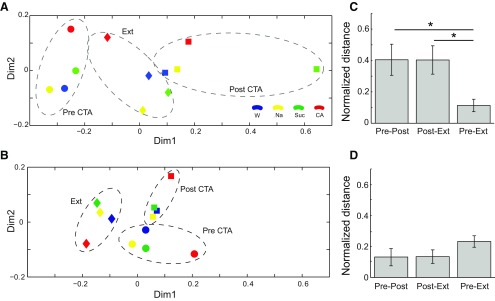
Figure 9.
The ensemble “response space” appropriately reflects behavior. A, Firing rate in the late state of held neurons (N = 19) projected on a 2D taste space, showing the similarity in late-state responses to the different tastes (colors) within different sessions (shapes). B, Same analysis as in A for the early state. C, The entire taste-to-taste response structure of Pre and Ext in the late state, calculated on the full-dimensionality solution (i.e., before reduction to 2D for A,B) are more similar than the other pair of sessions. Overall effect, one-way ANOVA, p = 0.029, followed by post hoc t tests. *p < 0.05. Error bars indicate SEM. D, Same analysis as in C for the early state shows no difference in each of the measures. One-way ANOVA, p = 0.39.

