Figure 2.
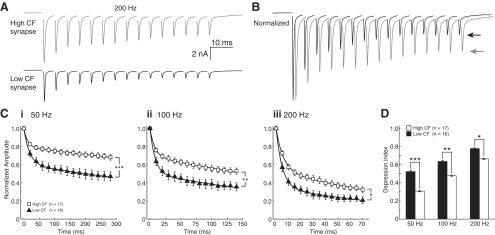
Synaptic depression of unitary synaptic inputs differs across the tonotopic axis in NM. A, Comparison of recordings in voltage clamp from two representative synapses in NM, 15-pulse stimulation at 100 Hz. High CF cell, gray trace; low CF cell, black trace. B, Overlay of traces in A, normalized to first EPSC (arrow indicates final amplitude, traces offset on time axis for clarity). C, Population data of normalized responses at 50 Hz (i), 100 Hz (ii), and 200 Hz (iii) for high (squares) and low (triangles) CF synapses. Curves shown are fitted to means with a double exponential function (see Materials and Methods). Time constants (τw) of fits for high and low CF synapses, respectively, were 1449.4 ms and 772.8 ms for 50 Hz, 329.7 ms and 204.1 ms for 100 Hz, and 77.6 ms and 49.5 ms for 200 Hz. D, Depression index is different at every stimulus rate for high (white bars) and low (black bars) CF synapses (Student's t test, n = 17 for high and 16 for low CF, 0.308 ± 0.130 and 0.524 ± 0.197, ***p = 0.000763 at 50 Hz; 0.479 ± 0.138 and 0.636 ± .179, **p = 0.00792 at 100 Hz; and 0.664 ± 0.132 and 0.778 ± 0.145, *p = 0.0251 at 200 Hz).

