Figure 3.
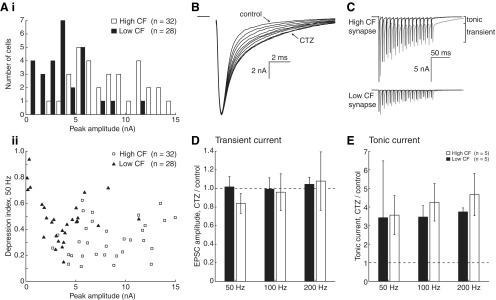
Postsynaptic contributions to STD are not tonotopically arranged. A, Distribution of initial peak EPSC amplitudes for high and low CF synapses. As observed in previous publications, this histogram (Ai) demonstrates that peak EPSC amplitude is larger for high CF cells (white bars) than for low CF cells (black bars). Bin centers are slightly offset for clarity. Below (Aii), peak EPSC amplitude is plotted with depression index, which is not correlated. B, EPSCs during application of CTZ. Recordings were taken every 20 s until the increase in decay time saturated (3–5 min). C, Representative traces from high and low CF cells in control (black) and 40 μm CTZ (gray). Tonic and transient current is highlighted, and traces are offset in the time axis for clarity. D, Change in transient EPSC amplitude (mean, final 3 pulses) after application of CTZ, as a fraction of control amplitude. Dashed line represents unity. Both low (black bars) and high (white bars) CF data are shown. E, Change in tonic EPSC amplitude (mean, final 3 pulses) after application of CTZ, as a fraction of control amplitude.

