Figure 6.
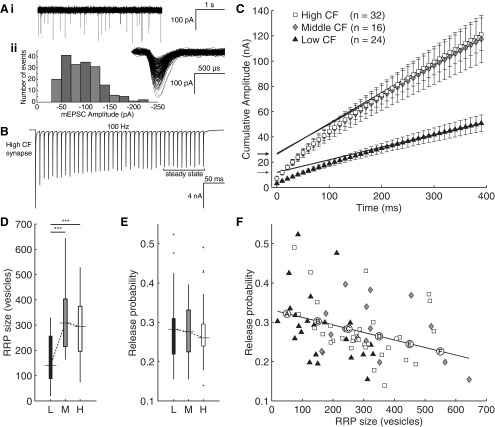
Readily releasable pool size varies systematically along the tonotopic axis. A, Representative sEPSC trace (4 s; Ai), and distribution of sEPSC amplitudes (Aii) recorded from a representative high CF neuron over a 30 s epoch (inset, aligned sEPSCs). B, EPSCs evoked in the same neuron by a 40-pulse, 100 Hz protocol shows depression to a steady state, measured as the final 10 pulses (highlighted). C, Cumulative amplitude plots of population averages for low (triangles, n = 24), medium (diamonds, n = 16), and high (squares, n = 32) CF groups. Linear fits to the final 10 pulse responses are extrapolated back to the y-intercept. Intercepts (arrows) indicate estimate of current from readily releasable vesicles. D, RRP size of low (black box), medium (gray box), and high (white box) CF synapses. Low CF synapses have a significantly smaller RRP size than both middle and high CF synapses (one-way between-subjects ANOVA, F(2,69) = 10.997, p = 0.000072, post hoc ***p = 0.00031 and ***p = 0.00055, respectively). E, Release probability of low (black box), medium (gray box), and high (white box) CF synapses trended downward but was not statistically different (one-way between-subjects ANOVA, F(2,69) = 0.141, p = 0.87). F, Scatter plot showing significant trend of inverse correlation between RRP size and release probability (r = −0.34, p = 0.0038). Points A–F mark values used in the mathematical model.

