Figure 7.
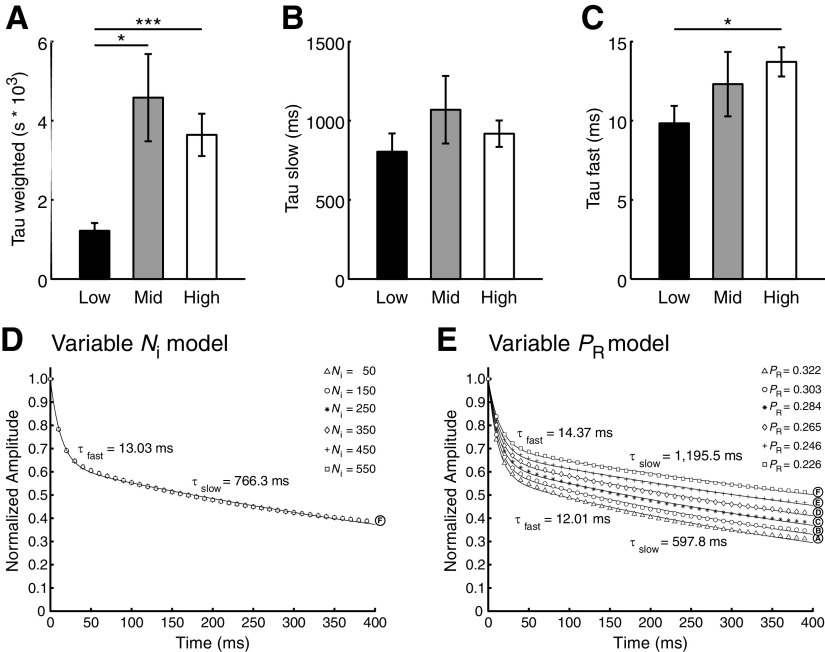
Observed release probability distribution is sufficient to generate tonotopic variation in STD. A, τw of synaptic responses to a 40-pulse protocol for low (n = 18), middle (n = 12), and high (n = 27) CF synapses. Six synapses that were not well described were excluded from analysis. Low CF synapses had significantly faster τw than both middle and high CF synapses (one-way between-subjects ANOVA, F(2,63) = 6.640, p = 0.0024, post hoc *p = 0.014 and p = ** 0.0035, respectively). B, τslow, which was not significantly different across the tonotopy (one-way between-subjects ANOVA, F(2,63) = 0.901, p = 0.41). C, τfast, which was significantly greater for high CF synapses than for low CF synapses (Student's t test, *p = 0.010). D, Mathematical model of normalized EPSC amplitude following a 40-pulse, 100 Hz stimulus. RRP size is varied in 6 conditions (A–F) according to the points on the fitted line in Figure 6F, while release probability is held constant at the observed population mean (0.2817). E, Mathematical model with release probability varied in 6 conditions (A–F) according to the points on the fitted line in Figure 6F, while RRP is held constant at the observed population mean (260.76 vesicles).

