Figure 3.
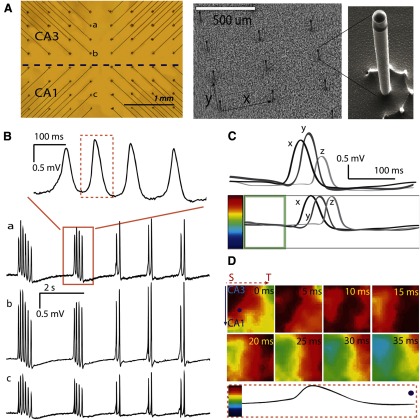
A, Left, Picture taken from the bottom of the array. The dashed line indicates the approximate location of the border between CA3 and CA1 when an unfolded tissue was placed on the array. Right, Scanning electron micrograph of the array. Microelectrodes were lined in a matrix pattern with a distance of 400 μm in the x direction and 300 μm in the y direction. The fabrication details have been previously published (Kibler et al, 2012). Inset, A single microelectrode with 20-μm-wide diameter and 200-μm-high, thereby giving a very high aspect ratio of 10. B, As marked in A, channels a–c show the spontaneous responses induced by 4-AP. Top, An expanded view of one group of events from channel a. C, Individual normalization. Top, Sample recordings x, y, and z from 3 different channels in the same time window have different amplitudes. Bottom, Individual signals are normalized before mapping. The average of the signal in the time window (one-fifth of the total time length, shown in the green box) was centered to the middle of the color bar. Every channel was normalized to its own amplitude, which means that the amplitude from the baseline to the peak amplitude would occupy the upper half of the color bar, no matter how large the absolute amplitude of the original signal had been. D, The propagation map of the peak included in the dashed box in B (100 ms time window) for all the 64 channels. Bottom, One channel (from the dot in the first frame) normalized to the color bar. Color maps present the propagation process with a 5 ms time step between frames. The map shows that activity originated in the septal corner in CA3 and propagated from the septal to temporal (dashed line with arrow) area of this tissue and transversely (solid line with arrow) from CA3 to CA1 resulting a diagonal wave front.

