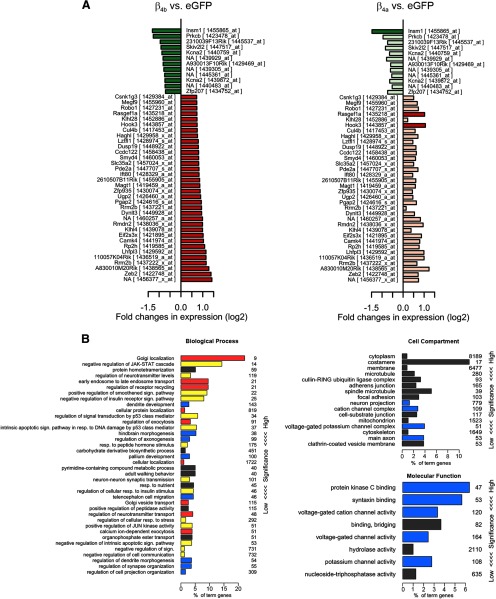
Figure 9.
Genes regulated by β4b and β4a and GO analysis. A, The 46 genes significantly regulated by β4b ranked according to the degree of upregulation (green) and downregulation (red) compared with the regulation of the same genes by β4a (faint colors, p > 0.05 in β4a). B, GO analysis of genes regulated by β4b or β4a by a log2-fold change of >0.7 and a FDR <0.1. The biological processes significantly (p < 0.05) enriched among this set of genes are related to cell signaling (yellow), membrane/vesicle transport including synaptic release (red), and neuronal development (blue). The significantly (p < 0.05) enriched molecular functions are predominantly ion channel and synapse related (blue). Numbers at right indicate the total number of genes of each ontology term.

