Figure 4.
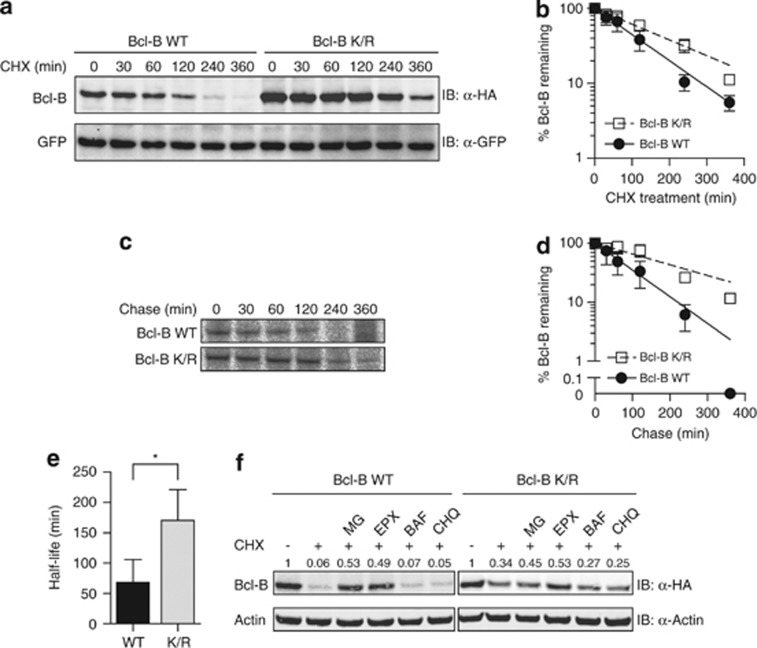
Ubiquitination targets Bcl-B for proteasomal degradation. (a) MOLT-4 cells stably expressing WT or K/R mutant HA-Bcl-B in an internal ribosomal entry site (IRES)–GFP configuration were treated with CHX (50 μg/ml) for the indicated time periods. Cell lysates were analyzed by immunoblotting for Bcl-B (α-HA) and GFP as a stable protein and loading control (α-GFP). Antibodies were labeled with fluorescent dyes to allow read-out on the Odyssey infrared imager. Data shown are representative of three independent experiments. (b) Quantification of three independent experiments such as shown in a. Data represent mean ±s.d. Bcl-B signal intensity was corrected for GFP signal intensity in the same cells, the 0-min time point was set to 100% and data points were connected by a one-phase decay curve fit. (c) The same cell lines as in a were labeled with [35S]-cysteine and -methionine for 30 min, followed by a chase with nonradioactive amino acids for the indicated time periods. Bcl-B was immunoprecipitated with anti-HA mAb and resolved by SDS–polyacrylamide gel electroporesis. Radioactive signals were quantified by phosphorimaging. Data shown are representative of three independent experiments. (d) Quantification of three independent experiments such as shown in c. Data represent mean ±s.d. Local background was subtracted from the HA-Bcl-B signals, the 0-min time point was set to 100%, and data points were connected by a one-phase decay curve fit. (e) The HA-Bcl-B half-life was calculated from the individual experiments shown in c. The mean half-life +s.d. standard are shown (n=3). Asterisk indicates statistically significant difference (Student's t-test; *P>0.05). (f) J16 cells stably expressing WT or K/R mutant HA-Bcl-B were treated with CHX, either alone or together with the proteasome inhibitors MG132 (MG, 50 μM) or epoxomicin (EPX, 10 μM), or the lysosome inhibitors bafilomycin A1 (BAF, 1 μM), or chloroquine (CHQ, 200 μM). After 8 h of treatment, cell lysates with equal protein content were analyzed by immunoblotting for Bcl-B (α-HA) or actin (α-actin). Data shown are representative of three independent experiments. Numbers above blot indicate signal intensity of HA-Bcl-B, corrected for actin signal, untreated sample of Bcl-B WT or Bcl-B K/R was set to 1.

