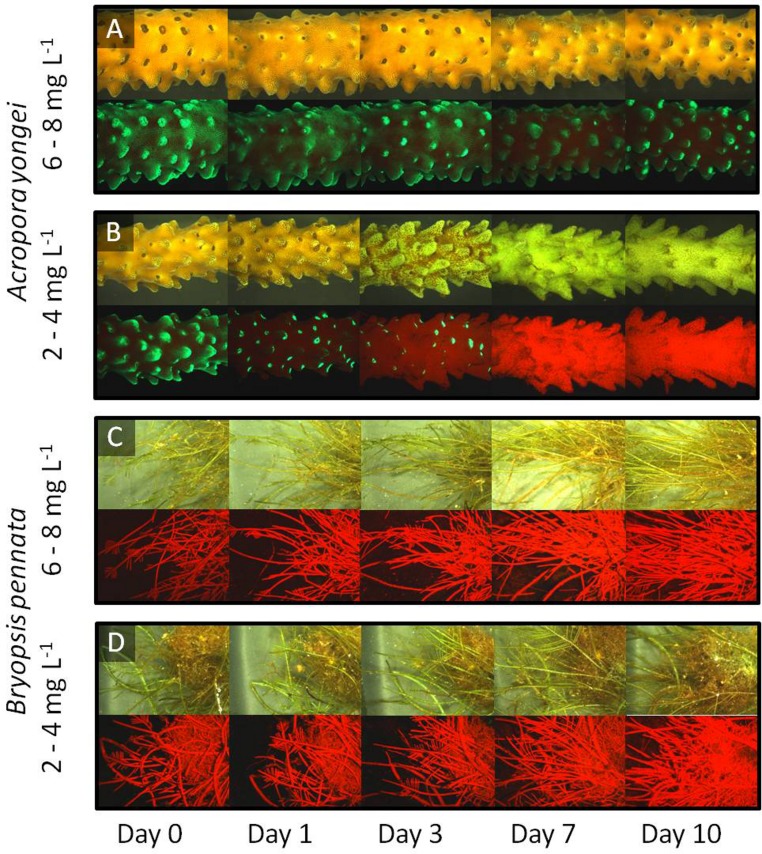
Figure 2. Fluorescence timeline.
Representative images of the coral A. yongei and the alga B. pennata in bright field (upper panels) and fluorescence (lower panels) for two different oxygen treatments over the time of the experiment. (A) coral 6–8 mg L−1, (B) coral 2–4 mg L−1, (C) alga 6–8 mg L−1, (D) alga 2–4 mg L−1.

