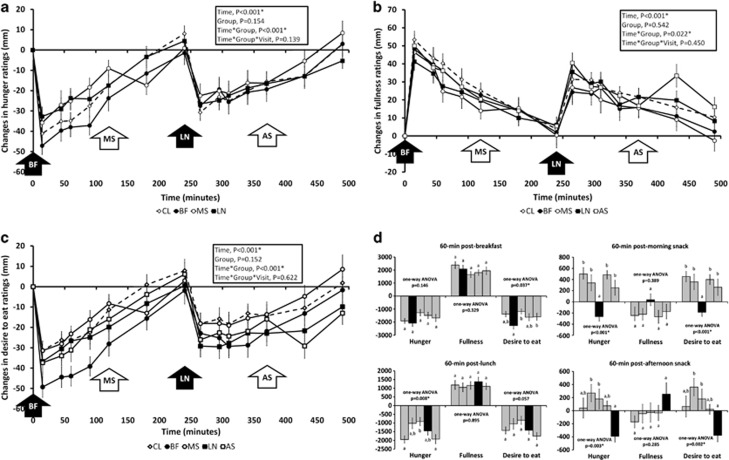
Figure 3.
Changes in hunger (a), fullness (b), desire to eat (c) ratings and 60-min postprandial incremental AUC for these appetite ratings (d) during acute-feeding sessions. Legend: solid bars in (d) represent study groups that received 43 g almonds. Bars in groups represent study groups CL, BF, MS, LN and AS from left to right.

